You can’t optimize what you can’t measure
In Tokenomics I argued that the subsidized, all-you-can-eat era of AI coding is over, and that developers now need to think like economists: tokens are a scarce resource, and every agent turn spends them. The obvious next question is the one an economist always asks first — what does it actually cost?
You can’t optimize what you can’t measure. So I built a tool to measure it: a GitHub Copilot CLI canvas extension that tracks token usage, AI units (AIU), and estimated cost, per session, on your own machine, with a rate card you control. The source is at cicorias/gh-app-canvas-token-usage, and the extension itself lives in the token-usage/ directory.
This post covers what it does, the interesting engineering underneath it, the libraries it (deliberately doesn’t) use, the installation constraints that shaped its design, and where it’s going next — specifically automated rate-card pulls and the thorny question of EMU-versus-public pricing.
What the extension does
A canvas in Copilot is an interactive HTML surface that lives beside the chat and updates in real time — both the agent and you can drive it. This one renders five tabs under a summary bar that is always visible.
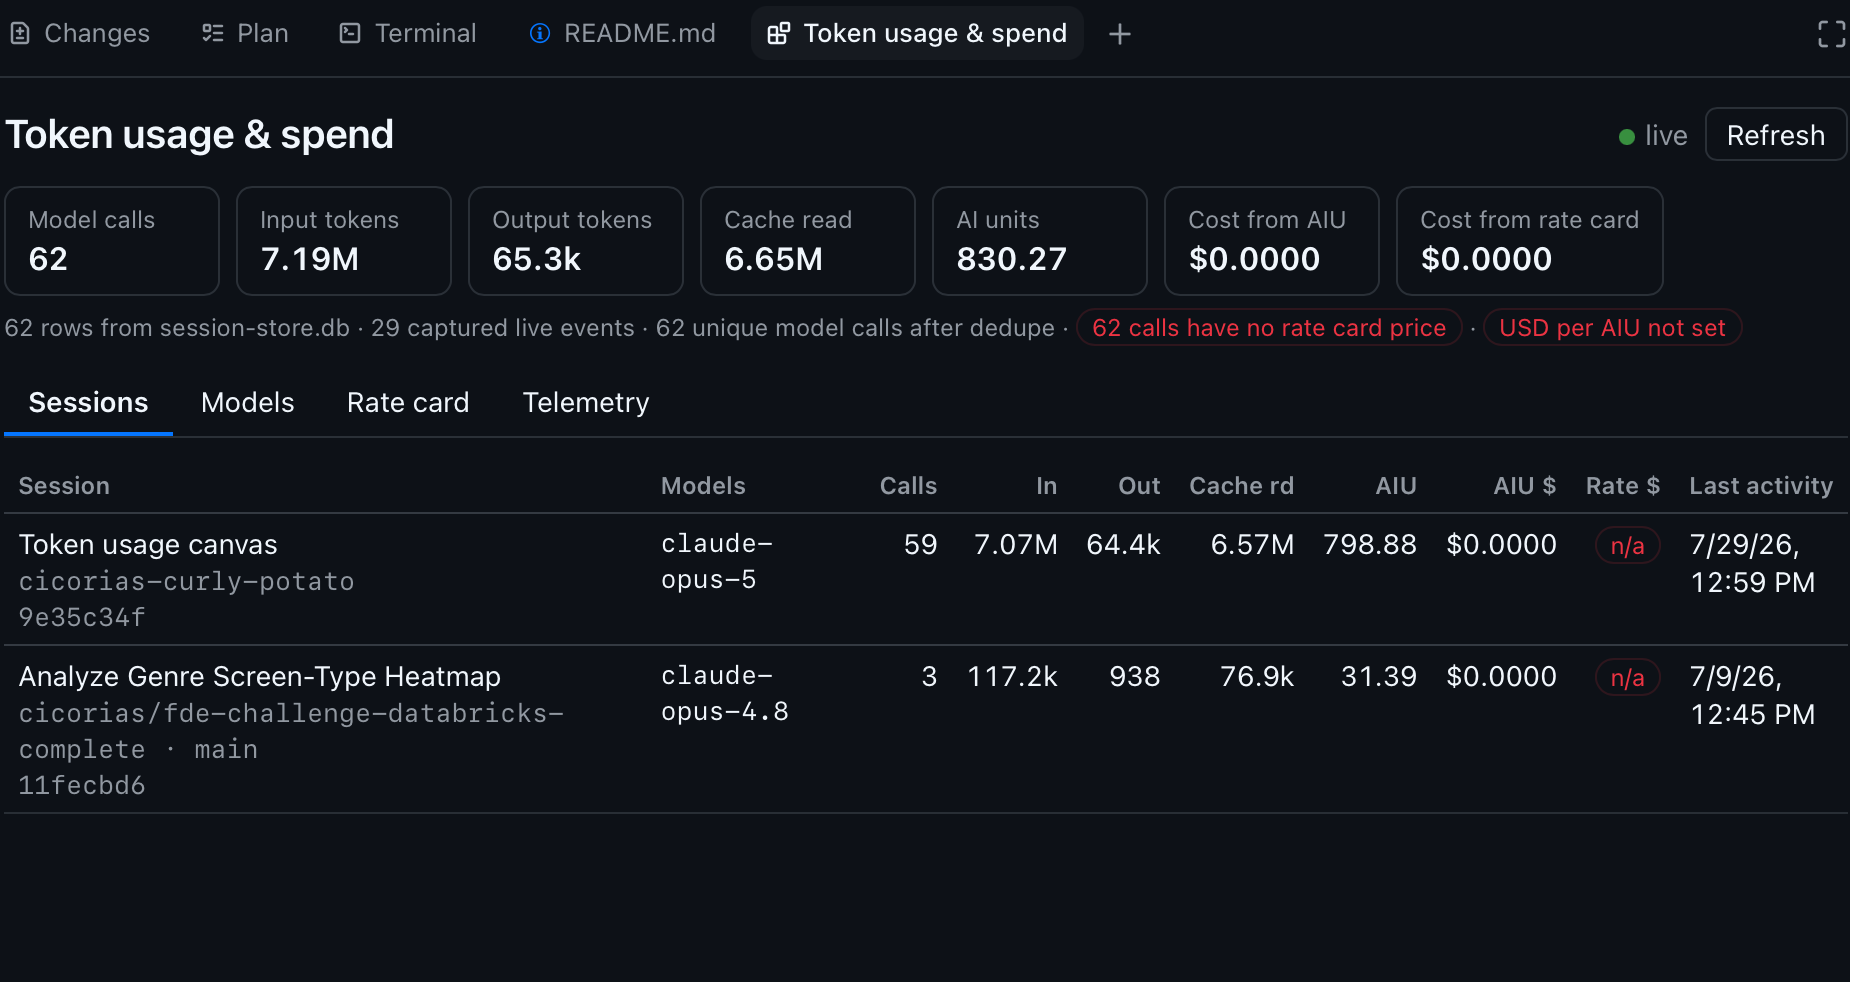
Sessions lists every session that has recorded usage on the machine, not just the current one: repo, branch, model calls, input/output/cache tokens, AIU, and both cost numbers. Click a row to drill into a per-call breakdown.
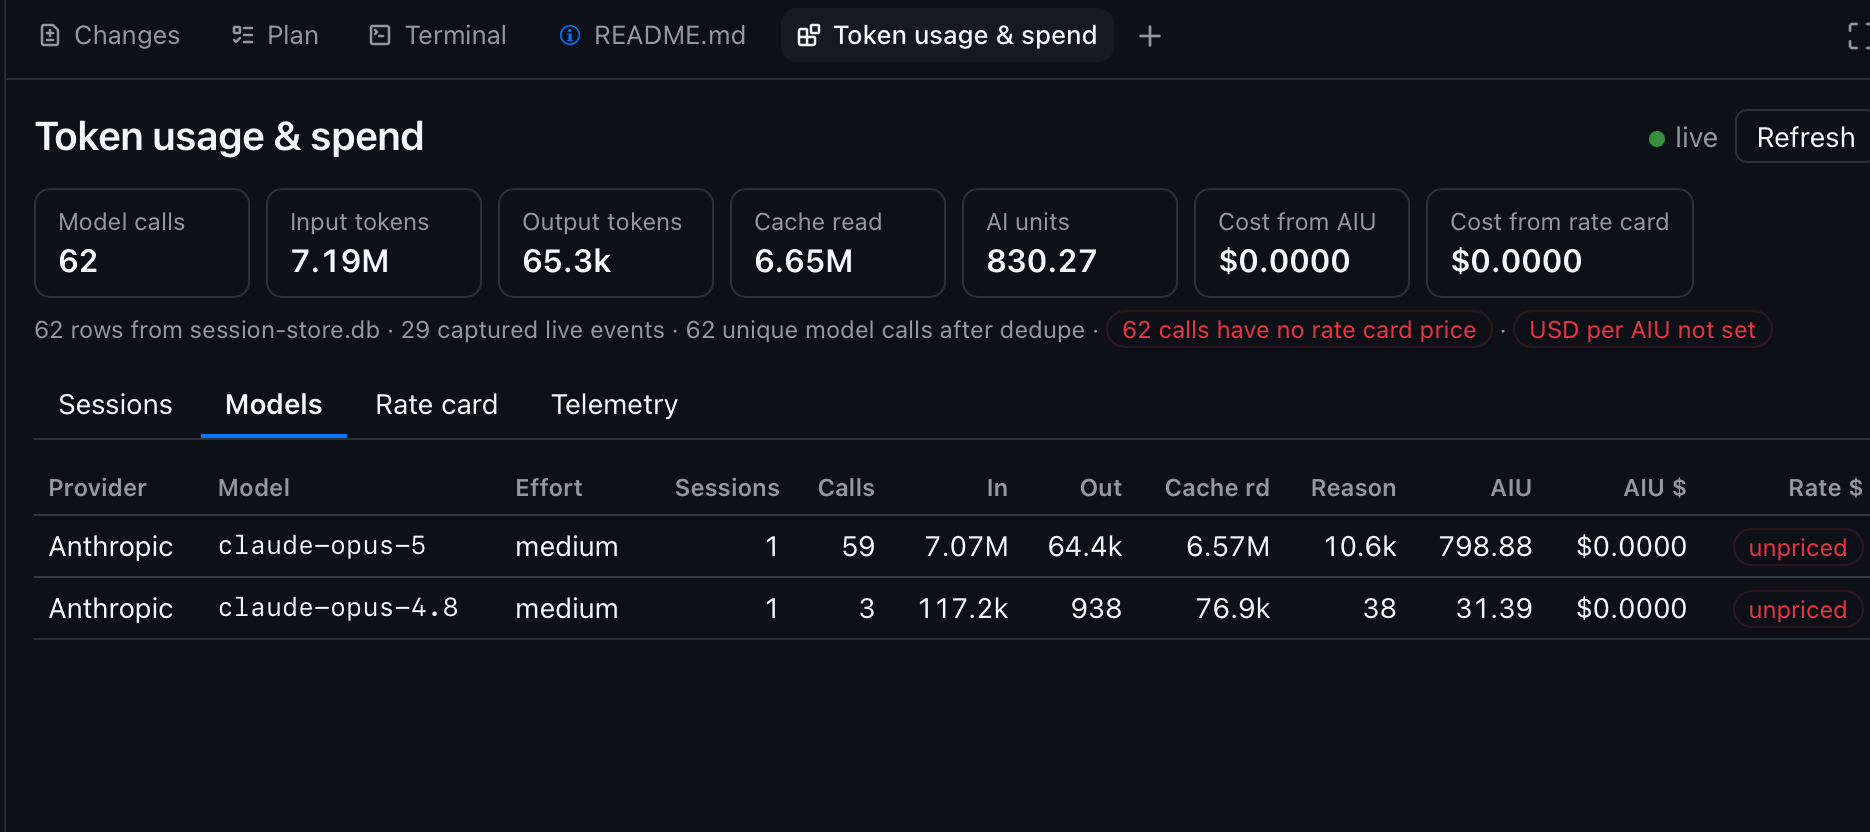
Models is the same data rolled up by provider × model × reasoning effort, so you can see where the volume and the money actually go regardless of which session spent it.
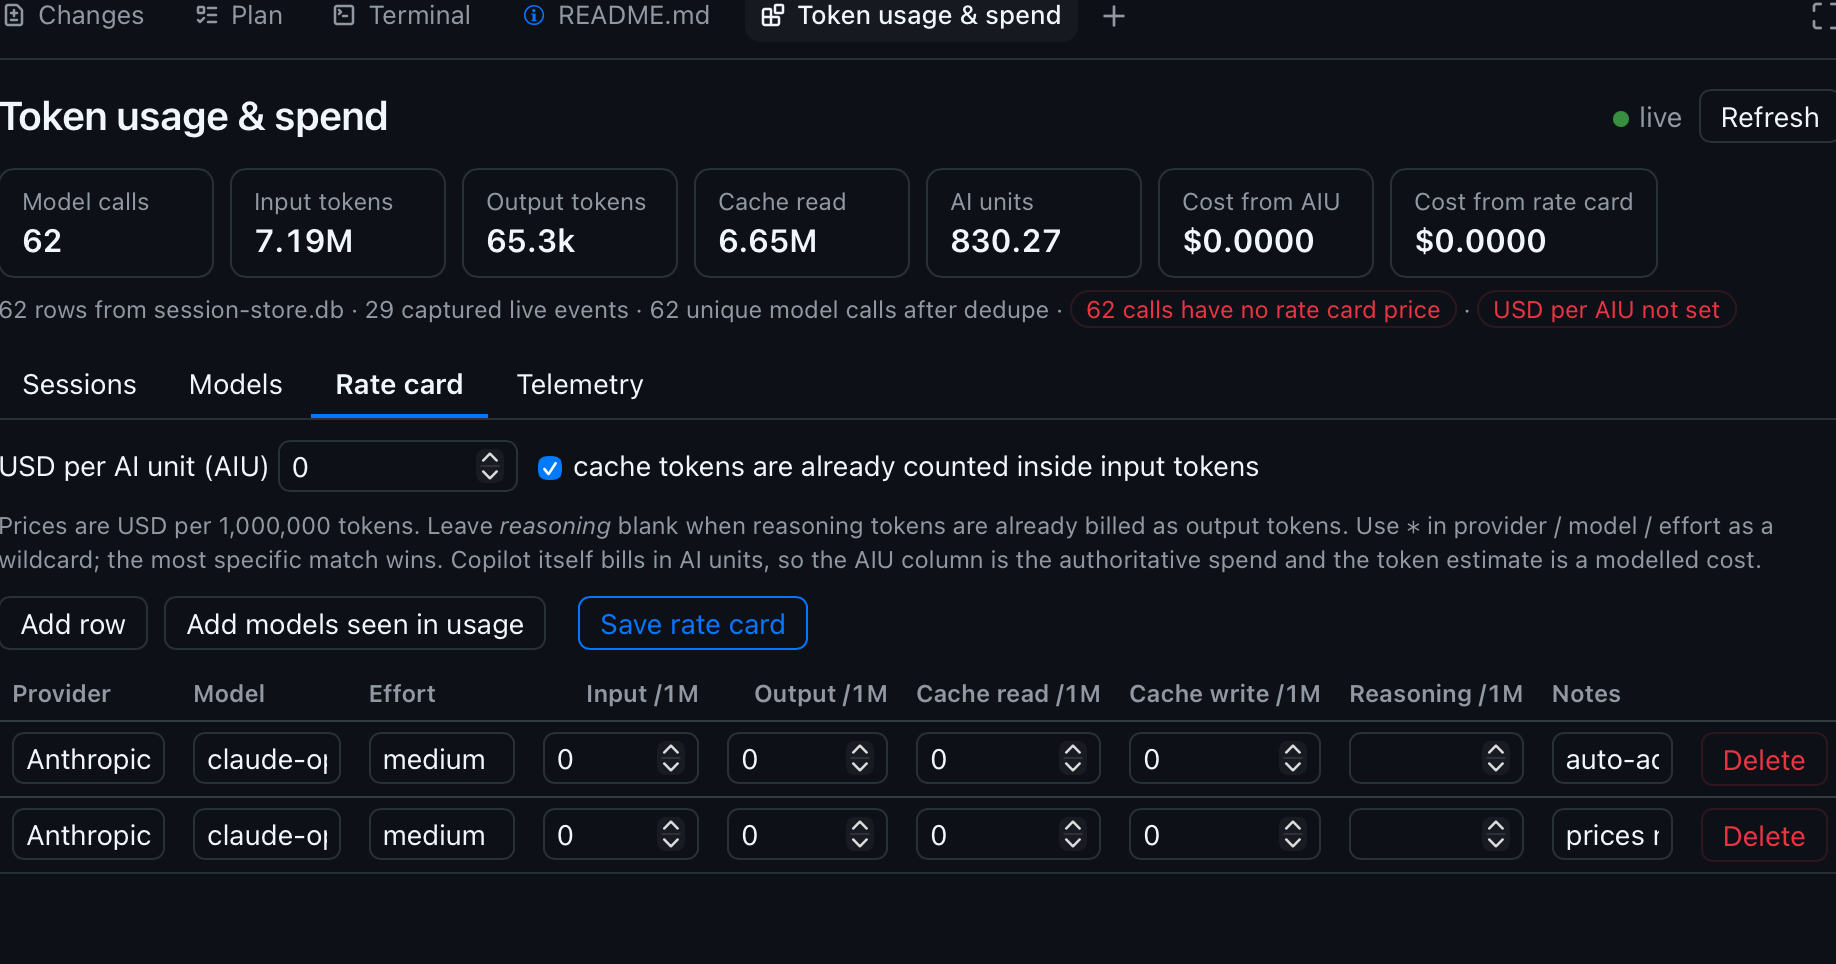
Rate card is an editable table of prices per 1M tokens (input, output, cache read, cache write, reasoning) plus a single global USD-per-AIU rate. It persists to disk, outside any repository.
Telemetry is optional: OpenTelemetry status, the exact env-var snippets to enable it, and ingestion of the OTel file exporter’s JSON-lines output for span- and tool-level timing. Settings, the fifth tab, turns Copilot’s OTel export on for the next launch without touching a terminal — and now carries a built-in, verified recipe for running a local collector (see below).
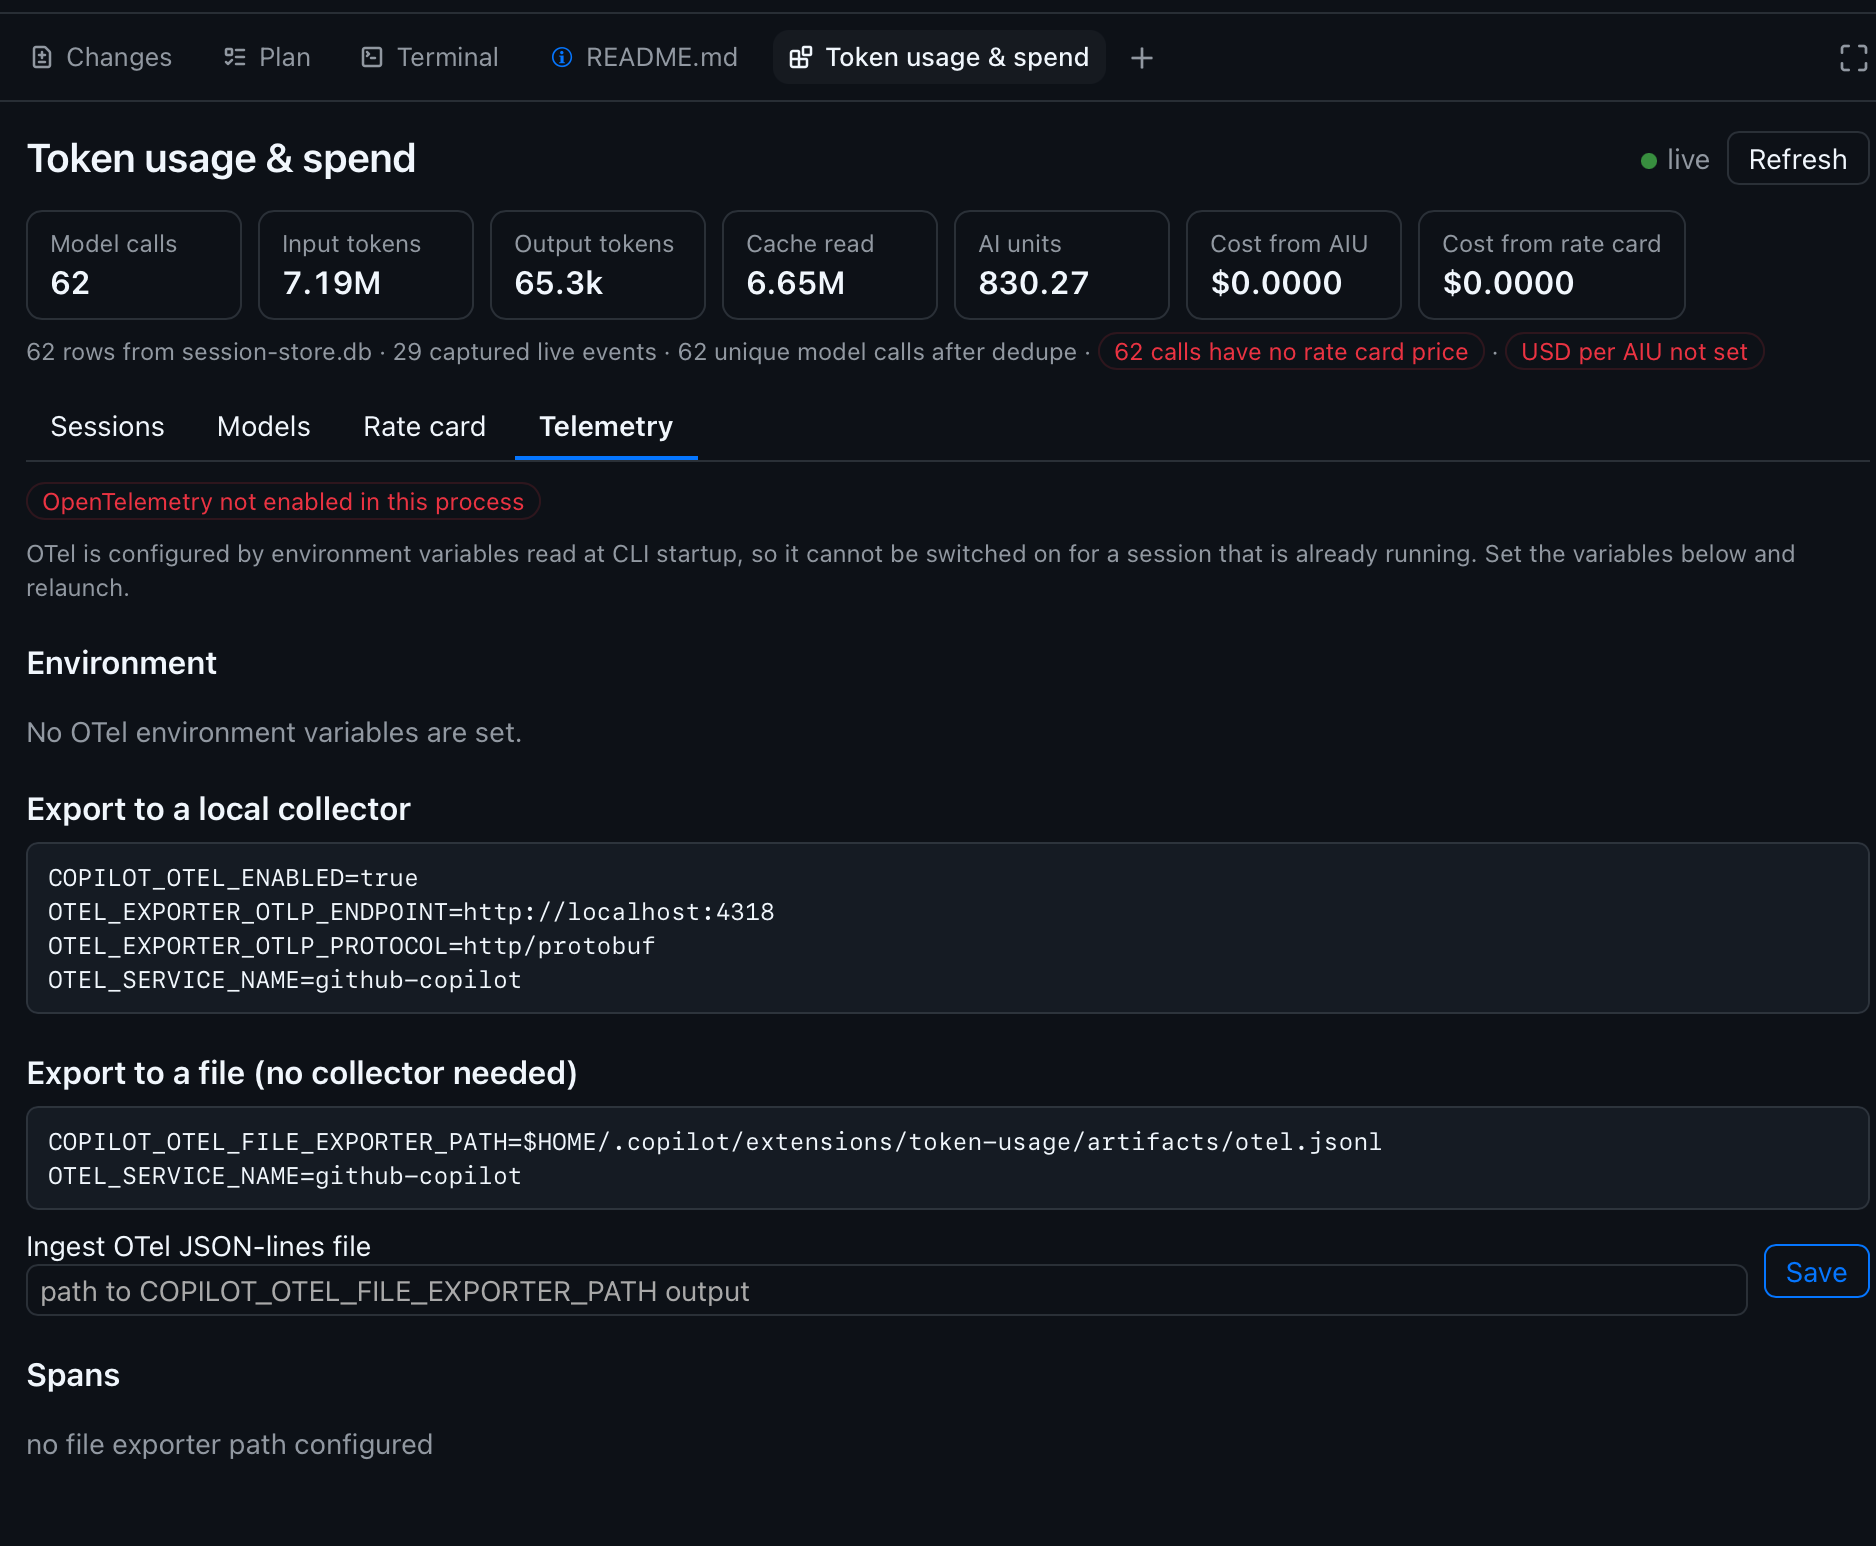
Those screenshots are a fresh, unpriced install — note the $0.0000 cost columns, the red USD per AIU not set pill, and the unpriced markers on every model. That is the intended out-of-box state, not a bug: no list prices ship with the extension, so the cost columns stay honestly empty until you supply your own. They also predate the Settings tab, which is why only four tabs appear.
The summary bar carries the numbers that matter — model calls after deduplication, token buckets, AI units, and a provenance strip telling you how many rows came from the store versus live capture, and whether anything is unpriced. A green dot means the Server-Sent Events stream is live and the view updates as calls complete.
Two cost numbers, on purpose
This is the part I care about most, and it’s the tokenomics thesis made concrete. Copilot bills in AI units, not raw tokens. Every usage row carries a total_nano_aiu value, so the canvas shows two independently-derived costs:
- Cost from AIU —
AIU × your USD-per-AIU rate. This tracks how you are actually billed. - Cost from rate card — a modelled token cost from your per-1M prices. Useful for comparing providers, sanity-checking, or pricing a BYOK endpoint.
Because those two numbers come from completely independent inputs, they form a built-in correctness check: if your rate card is right, they converge. Priced against this repo’s own history they agree to the cent:
AIU:             2395.50
Cost from AIU:  $23.96
Cost from card: $23.96
difference:     $0.00 (0.0%)
A large gap means one of the two is wrong — usually a missing cache-write price, an unpriced model, or the classic mistake of filling in a reasoning price when reasoning tokens are already billed as output.
Why this will matter more, not less
It’s tempting to assume falling per-token prices make this whole exercise obsolete. The opposite is true. As I argued in Tokenomics, this is the Jevons Paradox: when a resource gets cheaper, consumption doesn’t hold steady — it explodes. Agents are the accelerant. Each new model generation consumes more tokens per task than the last (GitHub’s own data shows the curve climbing), and every step in an agentic loop re-ingests the accumulated context. Cheaper tokens, far bigger bills. Metering isn’t a transitional annoyance until prices bottom out; it’s the permanent instrument panel for a workload whose consumption grows faster than its unit cost falls.
Prompt caching is the single biggest lever
Here’s the part most people underweight. In a multi-turn agent session, a large share of every request repeats: the system instructions, tool definitions, and repository context are re-sent turn after turn. Prompt caching lets the model reuse the computed state for a repeated prompt prefix instead of recomputing it — and a cache read is billed at a steep discount, commonly around one-tenth the price of fresh input tokens. On a long session, cache reads are usually the majority of your input volume. Whether they hit or miss is the difference between a cheap session and an expensive one.
Look back at the Sessions screenshot for how lopsided this gets in practice: 7.19M input tokens, of which 6.65M were cache reads — roughly 92% of all input volume served from cache. At a typical 10× discount, that one ratio is the difference between a session costing what it does and costing several times more. It is not a rounding error; it is the dominant term.
That is exactly why cache reads are a first-class metric in this extension — a dedicated Cache read figure in the summary bar and a per-call Cache rd column — and why the rate card has a separate Cache read /1M price and a cacheTokensIncludedInInput flag. You cannot reason about agent cost without seeing the cache-hit share, so the tool refuses to hide it.
The trap is how easily you break the cache. A cache hit requires the prompt prefix to match what was cached; anything that perturbs the prefix forces a miss and re-bills the whole thing at full price. The usual culprits:
- Switching models mid-session — a different model can’t reuse another’s cached prefix.
- Changing the toolset — adding, removing, or editing an MCP server or tool definition rewrites the prefix.
- Editing early context — mutating something near the top of the conversation invalidates everything cached after it.
If your Cache read number is low relative to input on a long session, that’s a signal worth chasing — you’re probably thrashing the cache with one of the above.
For the deeper mechanics, these are the best write-ups I’ve found, all recent and all specific to Copilot:
- The VS Code team’s Improving token efficiency for GitHub Copilot in VS Code — a genuinely good deep dive into the prompt prefix, caching, and the harness-level work to keep the cache warm across OpenAI and Anthropic models.
- The GitHub blog’s Getting more from each token — on increased prompt caching, deferred/tool-search loading, and model routing.
- Burke Holland’s Stop overpaying for AI: prompt caching, explained — a concrete, demo-driven walkthrough of what counts as a hit, what causes a miss, and how to estimate your own savings.
The takeaway that ties back to the tool: the AIU meter already prices your cache hits correctly, because caching is baked into GitHub’s metering. The rate card lets you model the same effect and see, in dollars, what a warm cache is saving you — and what a needless mid-session model switch just cost.
How it works — the interesting bits
There is real GitHub documentation on building these, and the extension follows it: an entry point named exactly extension.mjs, joinSession() to attach to the running Copilot session, and createCanvas() to register the HTML surface. If you want to build your own, start with the Copilot SDK extensions docs and the GitHub blog post How to build interactive experiences with canvases. What follows are the design decisions I found most interesting.
Three data sources, ranked by authority
Usage is assembled from three places, in order of trust:
$COPILOT_HOME/session-store.db → assistant_usage_events, read-only via Node’s built-innode:sqlite. This gives full retroactive history across every session and project with zero configuration — install it today and your last month of sessions is already there. The catch: this schema is internal to the Copilot app, so every access is written defensively. A missing database, table, or column yields no rows rather than an error. That is a deliberate posture — I am reading someone else’s private store, so it has to degrade gracefully when they change it.- The live
assistant.usagesession event. This event is markedephemeral: trueand never lands in the session event log, so the extension captures it and persists its own normalized copy tolive-usage.jsonl. This keeps the current session accurate before the app flushes rows to the store, and it survives a schema change in that internal store. - The OpenTelemetry file exporter (optional) for span and tool-execution detail — where the time goes, as opposed to the tokens.
The first two are merged and deduplicated on the tuple that uniquely identifies a model call, then pushed to the open canvas over SSE.
The OTLP decision I’m most opinionated about
The Telemetry tab reports your OTLP collector configuration but deliberately does not ingest from a collector endpoint. Pulling from a collector would require a receiver process outliving every session, for data the local stores already provide. So the extension ingests the file exporter instead — JSON-lines on disk, tail-read so a large log stays fast, no daemon to babysit.
One sharp edge worth knowing: Copilot disables OTLP export over cleartext http:// — including the default http://localhost:4318 — rather than sending telemetry unencrypted. And it does not fail loudly. It turns the exporter off and writes a warning to $COPILOT_HOME/logs, which is suppressed entirely at --log-level error. So the standard collector quickstart looks like it’s working while silently dropping every span. If your collector shows no data, that’s almost certainly why.
Making a local collector actually work
“Use an https:// endpoint” is easy to write and annoying to do, so the repo now ships a working recipe in examples/otel/: a .NET Aspire dashboard behind TLS, as a Compose file with bash and PowerShell wrappers. With mise it’s one command on any platform:
mise run start        # certificates, dashboard over TLS, and a real test span
mise run otel:down    # stop
Then point Copilot at it and restart — the OTLP variables are read once at process start:
OTEL_EXPORTER_OTLP_ENDPOINT=https://localhost:4318
OTEL_EXPORTER_OTLP_PROTOCOL=http/protobuf
OTEL_EXPORTER_OTLP_CERTIFICATE=<cert-dir>/ca.crt
Getting there cost real debugging time, and the findings are the genuinely useful part:
- A single self-signed certificate does not work. Copilot’s TLS stack rejects a CA certificate presented as the server’s own leaf, and all you get is
[rust:otel] HTTP export failed: network error. You need a proper two-certificate chain where a CA signs a leaf. NODE_EXTRA_CA_CERTShas no effect. The exporter’s transport is native Rust, not Node, so the usual Node escape hatch does nothing. UseOTEL_EXPORTER_OTLP_CERTIFICATE.- The leaf needs an Authority Key Identifier. Copilot tolerates its absence, but OpenSSL 3 clients — including anything using Python’s
ssl— reject the chain withcertificate verify failed: Missing Authority Key Identifier. Tolerant consumers hide bugs that stricter ones expose. - macOS ships LibreSSL, not OpenSSL, so
openssl x509 -extdoesn’t exist there and the scripts stick to portable invocations.
That third point has a nice moral. The repo includes verify-otlp.py, a PEP 723 script (dependencies declared inline, uv resolves them into a throwaway environment) that sends one real span end to end. It exists because the OpenTelemetry SDK swallows export failures by default — so the script captures the SDK’s warning log specifically to tell success apart from silence. Being stricter than Copilot is the feature: it’s what caught the missing Authority Key Identifier.
There’s a theme here connecting the OTLP behavior, the SDK’s swallowed errors, and the blank-tab bug below: silent failure is the enemy. Every one of these cost time precisely because something chose to say nothing.
macOS launch environment, the annoying detail
OTel is configured by environment variables read at CLI startup, so it can’t be switched on for a session that’s already running. Worse, the desktop app launches from Finder or the Dock — it never sees your shell profile, so there’s no export to inherit. The Settings tab solves this on macOS by writing the variables into the launchd GUI domain (launchctl setenv) — the environment LaunchServices actually hands to app launches — plus a small LaunchAgent so they survive a logout. It’s an unglamorous detail, but it’s exactly the kind of thing that separates “works on my terminal” from “works when you double-click the icon.”
A live canvas fights the form you’re typing in
Here’s a bug I shipped and then had to fix, and it generalizes past this project. The canvas re-renders on every live usage event — that’s the point of the SSE stream. But the Settings tab is a form. The refresh path reloaded config straight from the API and re-rendered, which meant a burst of model calls could wipe out half-typed input while you were still filling it in. Live-updating dashboards and stateful forms want opposite things from the same render loop.
The fix is to treat server state and edit state as separate: seed the form’s config once, then let live refreshes update the read-only panels while leaving in-progress edits alone. Stale-but-yours beats fresh-but-clobbered.
The same commit fixed a worse failure mode. That config object was never initialized, so the render function threw on a property access and left the panel completely blank — which reads as a feature that does nothing rather than a bug that needs reporting. Now every tab render is wrapped so a thrown error paints a visible banner (and still rethrows, so it reaches the console). For a tool whose entire job is to make hidden numbers visible, silently rendering nothing is the one failure mode I can least afford.
The libraries: a deliberate zero
Here’s the part that surprises people. The extension has no third-party dependencies. None. There is no package.json with a dependency list, no node_modules, no lockfile to audit.
Everything is either a Node built-in or resolved by the CLI:
node:http— the loopback HTTP server that serves the canvas and the SSE streamnode:sqlite— the read-only reader forsession-store.db(this is why Node 22+ is required)node:fs,node:path,node:os,node:url— artifact storage and path resolutionnode:crypto— id generationnode:child_process—launchctlon macOS for the login-environment work@github/copilot-sdk/extension—joinSession,createCanvas,CanvasError, resolved by the CLI itself, not installed
For a security-conscious tool that reads your usage data and writes your pricing, a zero-dependency footprint is a feature, not an accident. There is no supply chain to compromise, nothing to npm audit, and the whole thing is a single directory of ES modules plus one ui.html you can read top to bottom. Nothing is ever sent anywhere: the canvas is served on an ephemeral loopback port and reads only local files.
Installation constraints
The constraints here are mostly about scope and where data lives, and they drove several design decisions.
Requirements are minimal: a Copilot CLI with canvas support, and Node 22+ for the built-in node:sqlite module. That’s the whole list.
Three install scopes, each with a destination and an audience:
| Scope | Destination | Who gets it |
|---|---|---|
| User | $COPILOT_HOME/extensions/token-usage/ | you, in every project |
| Project | <repo>/.github/extensions/token-usage/ | anyone in that repo, no install step |
| Session | $COPILOT_HOME/session-state/<id>/extensions/token-usage/ | the current session only |
A few sharp constraints fall out of this:
- Project scope shadows user scope. Install the same-named extension at both and the user copy is dropped at discovery time. Don’t install both.
- Discovery only scans one level deep under
.github/extensions/, so a vendored copy has to sit exactly one directory down. - The entry point must be named
extension.mjsand live at the top of the folder. - Data never lives with the extension. Every user-owned artifact —
rate-card.json,live-usage.jsonl, OTel settings — is written to$COPILOT_HOME/extensions/token-usage/artifacts/, outside any repository, regardless of the scope the extension is installed at. This is what makes it safe to vendor a project-scope copy into a team repo: your negotiated pricing never gets committed.
Install is a one-liner that works piped from the network or from a clone:
curl -fsSL https://raw.githubusercontent.com/cicorias/gh-app-canvas-token-usage/main/install.sh | sh
irm https://raw.githubusercontent.com/cicorias/gh-app-canvas-token-usage/main/install.ps1 | iex
Where the numbers come from — and why it matters
A fresh install ships an empty rate card. Every price starts at $0.00 until you fill it in, and that’s on purpose: no list prices are shipped or guessed on your behalf. The single most important field is USD per AI unit, which GitHub documents at a fixed $0.01 (it calls the billing unit an AI credit; one credit is one AI unit). Set that one value and every AIU column becomes real money with no per-model work at all.
For the modelled per-token cost, the rule is blunt: use GitHub’s rates, not the model vendor’s. When you use Copilot you are billed by GitHub, at GitHub’s published per-token rates — which for several models differ from Anthropic’s or OpenAI’s own pricing pages by a large multiple. Pulling numbers from the vendor’s site is the easiest way to end up confidently wrong.
What’s next: upcoming work
Three issues are open, and they’re the roadmap. All three are the kind of thing that only becomes obvious once real people run the tool.
1. Automating the rate-card pull (#4)
The rate card ships empty and every price is typed in by hand. That’s tedious once and, worse, silently goes stale — prices change, promos expire, new models ship, and nothing notices. A stale card produces a confidently-wrong cost column, which is worse than an obviously empty one.
The good news is there’s a structured source. GitHub’s pricing tables aren’t hand-written markdown — they’re generated from a machine-readable YAML file in the public github/docs repo:
https://raw.githubusercontent.com/github/docs/main/data/tables/copilot/models-and-pricing.yml
It maps almost 1:1 onto the rate card (input, cached_input, cache_write, output, provider), and the USD-per-AIU constant lives in the same repo’s product.yml. So the plan is an Update rates from GitHub docs button that fetches the YAML, maps it, and shows a diff before writing anything — never clobbering hand-edited prices silently.
The interesting part isn’t the fetch, it’s the mismatches:
- Display names aren’t API ids. The docs say
Claude Opus 5; usage rows carryclaude-opus-5. A slugify gets most of the way, butGemini 3.1 Pro→gemini-3.1-prowhen the real id isgemini-3.1-pro-preview. So: slugify plus an explicit override map, and report anything unmatched rather than guess. - Footnotes encode promotional pricing that expires on a date — precisely the thing that goes stale — so those want surfacing as row notes.
- Tiered (long-context) models appear as two rows. The rate card matches on provider/model/effort only, with no context-tier concept, so the importer takes the Default tier and records the threshold in notes rather than pretending to solve tiering.
- Offline must fail cleanly and leave the existing card untouched. Adding an outbound fetch to a tool that until now read only local files is a deliberate change in posture — it must be user-initiated, never automatic on canvas open.
And there’s a beautiful built-in test: the importer is correct when it reproduces the AIU-versus-rate-card convergence shown above, without a single manual entry.
EMU versus public rates
This is the wrinkle worth calling out on its own. The github/docs YAML is the public price list. But not everyone pays public rates. Enterprise agreements, volume commitments, and Enterprise Managed Users (EMU) tenants can carry negotiated pricing that simply isn’t in a public repo. An automated pull from public docs is exactly right for an individual on a paid plan and potentially wrong for someone billed under an enterprise contract.
The design already leaves room for this, and I want to make it explicit:
- The AIU column is the source of truth for enterprises, because
total_nano_aiucomes from Copilot’s own metering — whatever your contract, the AI units you consumed are the AI units you consumed. Set your negotiated USD-per-AIU rate and the AIU cost is correct by construction. - The rate-card column is the model, and it’s yours to override. An EMU or enterprise customer would layer their negotiated per-token numbers on top of (or instead of) the public pull.
So the future importer should treat the public YAML as a default seed, clearly labelled as public pricing, and never silently overwrite a rate a user has marked as contracted. Pairing this with per-workspace rate cards (below) is what lets one machine model a public-rate side project and an EMU-billed client repo at the same time.
2. Oh-my-zsh-style install and update (#2)
Today’s installer copies files, which is fine once and bad forever after: no record of which ref was installed, no update path, and cp never deletes files removed upstream. The plan follows the oh-my-zsh model — install is a clone, update is a git pull --ff-only that refuses to run on a dirty tree, reports the changelog, and surfaces the installed short SHA in the canvas footer so the agent can answer “am I current?” directly.
3. Per-workspace artifacts (#1)
Right now the extension can be installed per scope, but its data is always global — one rate card shared across every checkout. That’s wrong for anyone who wants a different rate card per client (different negotiated pricing, different BYOK provider) or OTel on for one project but not another. The fix resolves artifacts by scope with a user-level fallback, keyed off the repo root, with an explicit TOKEN_USAGE_ARTIFACTS_DIR override so it’s never guesswork. This is the other half of the EMU story.
Other things I’d add
A few directions I’m considering, in rough priority:
- Budgets and alerts. Once you have per-session cost, a soft cap — “warn me when this session crosses $5” — is a small step and a big behavioral nudge. It’s the tokenomics point turned into a guardrail.
- Model substitution suggestions. The Models tab already knows where the money goes. Surfacing “this workload ran on
opusathigh; a cheaper tier would have cost X” turns measurement into optimization. - Export. CSV/JSON export of the session and model rollups for anyone who wants to pivot this in a spreadsheet or feed it to their own dashboard.
- A CI gate. The
--dry-rundiff from the rate-card importer could run in CI and fail when public prices drift, turning a silent staleness problem into a reviewable pull request. - Long-context tier support. The known gap — teach the matcher a context threshold so tiered OpenAI/Google/xAI models price correctly per call instead of approximating.
- Span-level cost attribution. Now that a local collector is a one-command affair, joining OTel spans to usage rows would answer “which tool cost me the most,” not just which model — the time dimension and the money dimension on one axis.
Watch the meter
The economics only get real once you can see the meter. Copilot already knows what every call cost in AI units; this extension just puts that number, and a model of it, in front of you as you work — with no telemetry to enable, no data leaving the machine, and no dependencies to trust. If you’re running agentic sessions daily, watching that number is the cheapest optimization you’ll make.
Source, issues, and install instructions: cicorias/gh-app-canvas-token-usage.